FIMMPROPA bi-directional optical propagation tool |
   |
A 1x8 Planar MMI Coupler3D simulation with FIMMPROP softwareIn this example we used FIMMPROP to model a 1x8 planar MMI coupler based on a AlGaAs/GaAs rib waveguide geometry. Benefits of using FIMMPROP to model MMI couplersEME (EigenMode Expansion) is the ideal method to model MMI couplers. The physics of MMIs results from constructive and destructive interferences between a small number of guided modes; it is these interferences that give MMIs their ability to generate multiple images of the input beam. EME is a mode-based approach, and it therefore offers an extremely efficient way of modelling such devices. The implementation of EME in FIMMPROP offers an optimal framework for this application, with a potential for highly efficient optimisation and fully vectorial solutions:
Modelling a 1x8 MMI couplerFIMMPROP was used to design and simulate in rigorous fully vectorial 3D a 1x8 MMI coupler based on a AlGaAs/GaAs rib waveguide geometry, working at a wavelength of 1.103um. The single-mode input waveguide was located in the centre of the device. The length of the central section and the lateral positions of the output waveguides were optimised using scanners. A power transmission of 92.46% was obtained. The power was transmitted to each output waveguide in a fairly equal way, with a standard deviation of only 0.11% for each waveguide.
Scan the length of the MMI instantly!The device was optimised by scanning the length of the multimode section and the lateral positions of the output waveguides. FIMMPROP relying on EME, the length of a section of the device can be changed at a minimal cost in calculations and time. Simulating the MMI coupler with FIMMPROP took 5 minutes 30 seconds with an Intel Pentium 4 CPU running at 3GHz, with 80 modes included in the multimode section. Once the MMI coupler simulated, obtaining the evolution of transmission when scanning the length of the multimode section over 200 values only took 7 seconds! The results are plotted in the graph below.
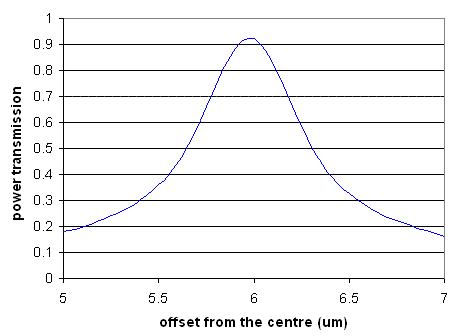
The graph below shows the evolution of transmission when the lateral positions of the output waveguides are varied. Varying the position of the waveguides implied that the modes of the last section had to be recalculated, as well as the overlap integrals in the joint between the multimode section and the output section. Nevertheless, performing this scanner only took 13 seconds per point!
It is also possible to optimise both parameters simultaneously thanks to our integrated optimiser Kallistos. You can see an example of 1x4 MMI optimisation here.
|


